Henrik Roth · 5 October 2026
Safety Statistics Highlight Potential Links to Upcoming Park Planning Decisions
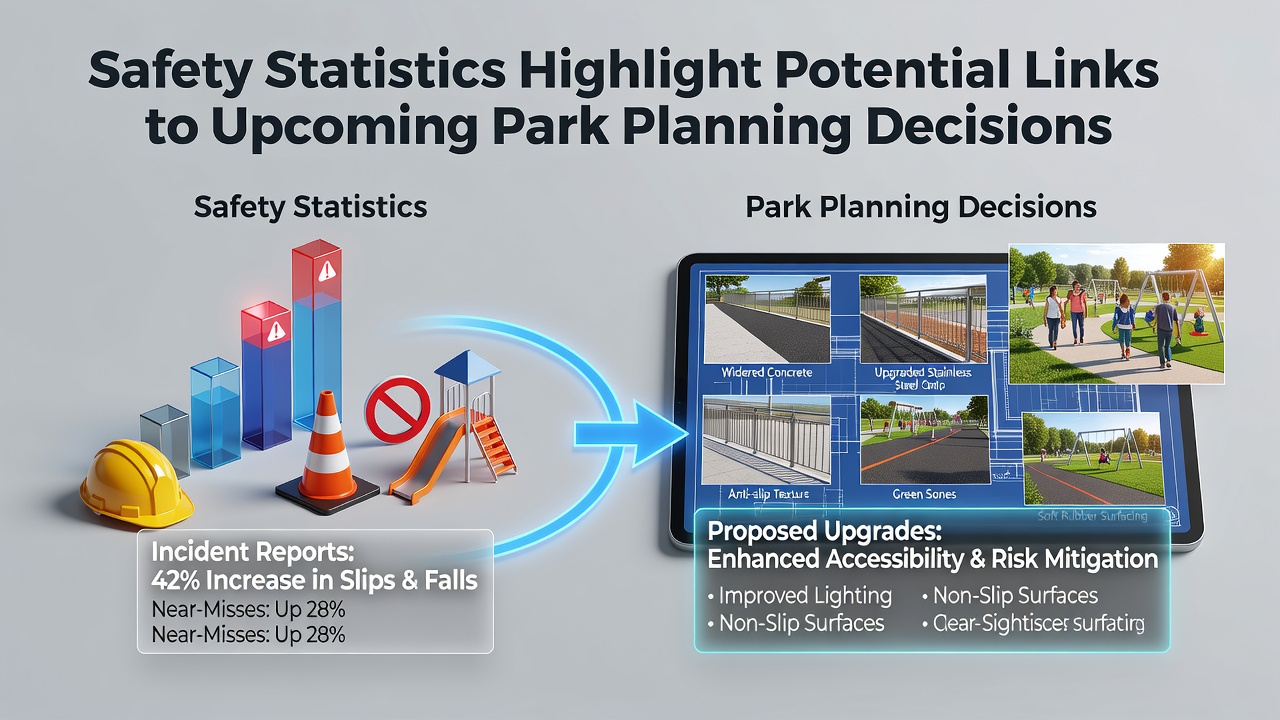
Data from multiple regional monitoring programs shows steady patterns in park-related incidents that local authorities now review when shaping future development plans, and these figures cover everything from minor slips to more serious injuries across public recreational areas. Researchers at various institutions have compiled records indicating that pathways with uneven surfaces account for a notable share of reported cases, while lighting deficiencies correlate with evening incidents in several documented sites.
Current Incident Patterns Across Park Systems
Figures released by national health agencies reveal that recreational spaces experience thousands of injury reports annually, with many concentrated around playground equipment and trail intersections, and analysts point to seasonal spikes during summer months when visitor numbers rise sharply. In Creamvale specifically, maintenance logs from the past five years list over two hundred incidents tied to older infrastructure, prompting planners to cross-reference these locations against proposed expansion zones.
European data compiled by the European Environment Agency further illustrates how design elements such as fencing height and surface materials influence outcome rates, and observers note that parks incorporating rubberized flooring report lower fracture statistics compared with traditional grass or dirt layouts. Those reviewing the numbers emphasize that age demographics play a role too, since children under twelve represent a disproportionate segment of the totals in most urban datasets.
How Statistics Inform Planning Choices
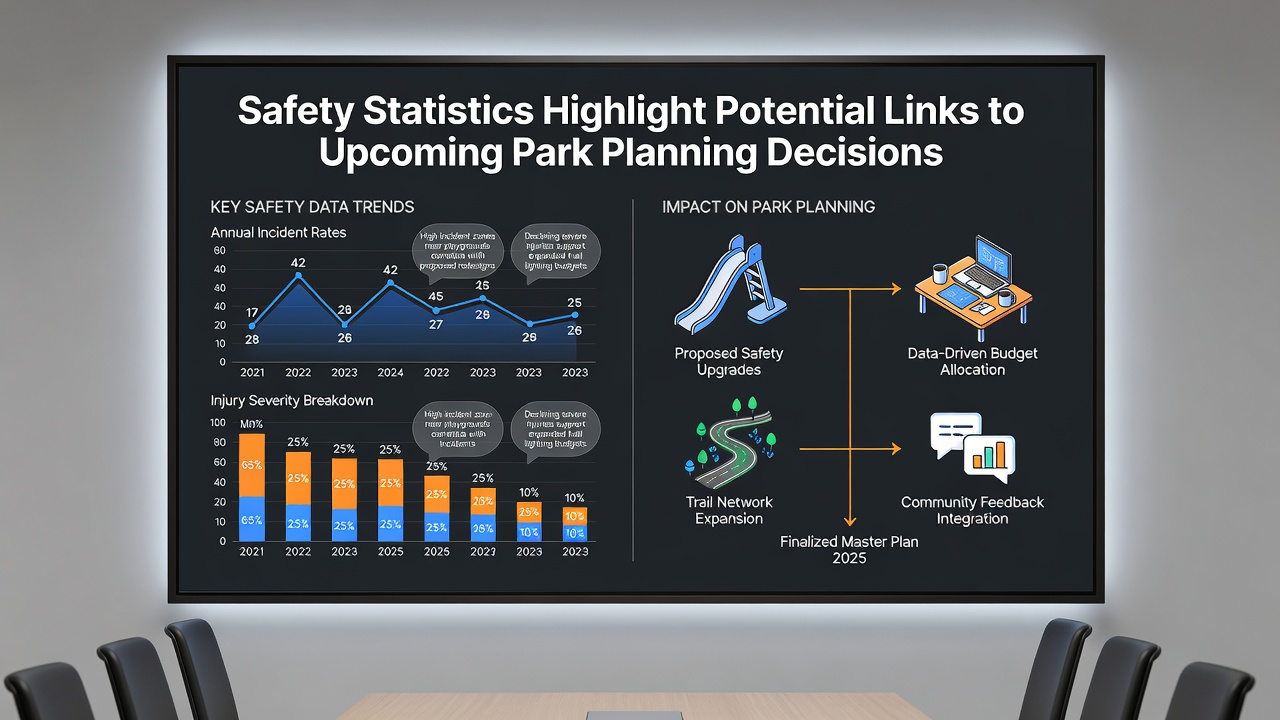
Planning departments in several municipalities now integrate these safety metrics directly into site selection processes, and the approach allows officials to prioritize upgrades in high-incident zones before new facilities open. Data indicates that retrofitting existing trails with better drainage and signage has reduced repeat occurrences in comparable communities, while new builds increasingly include input from safety auditors during the blueprint stage.
One study from the Centers for Disease Control and Prevention examined over fifty park projects and found measurable drops in emergency visits after targeted improvements, and this evidence has encouraged similar reviews ahead of Creamvale's scheduled October 2026 decision cycle. Planners there have already begun mapping incident clusters against available land parcels to determine which areas might benefit from enhanced visibility features or additional staffing.
Regional Comparisons and Broader Trends
Australian health authorities have published parallel findings showing that coastal parks with added shade structures experience fewer heat-related calls, and this has led some North American districts to adopt similar elements in their own proposals. What's interesting is how the same datasets also highlight traffic adjacency risks, since parks near busy roads show elevated pedestrian collision numbers unless separated by buffers or crossings.
Those who've examined Creamvale's preliminary reports observe that older neighborhoods carry higher baseline incident rates, and this pattern aligns with national trends where deferred maintenance intersects with denser usage. Authorities therefore weigh these variables when allocating budgets, often favoring incremental safety enhancements over entirely new construction in certain districts.
October 2026 Planning Timeline
Local records confirm that the upcoming council review in October 2026 will incorporate the latest safety compilations, and participants expect discussions to focus on three candidate sites already flagged for elevated risk factors. Maps prepared for the meeting overlay incident density with projected visitor flows, giving decision makers a clearer picture of where interventions could yield the strongest results.
Industry reports from the National Recreation and Park Association further support this data-driven method, noting that communities adopting similar protocols have documented sustained reductions in liability claims over multi-year periods. The Creamvale process now includes public comment periods specifically addressing these statistical summaries, allowing residents to review the underlying numbers before final selections occur.
Conclusion
Overall patterns emerging from safety statistics continue to shape how park planning unfolds, and the integration of these figures into October 2026 deliberations represents a continuation of practices already underway in other regions. By aligning development decisions with documented incident data, authorities aim to create spaces that accommodate higher usage while addressing the specific conditions that contribute to reported events.