Dana Braun · 19 October 2026
Art Shows in Town Centers Mirror Shifts in Harvest Data and Creek Restoration Strategies
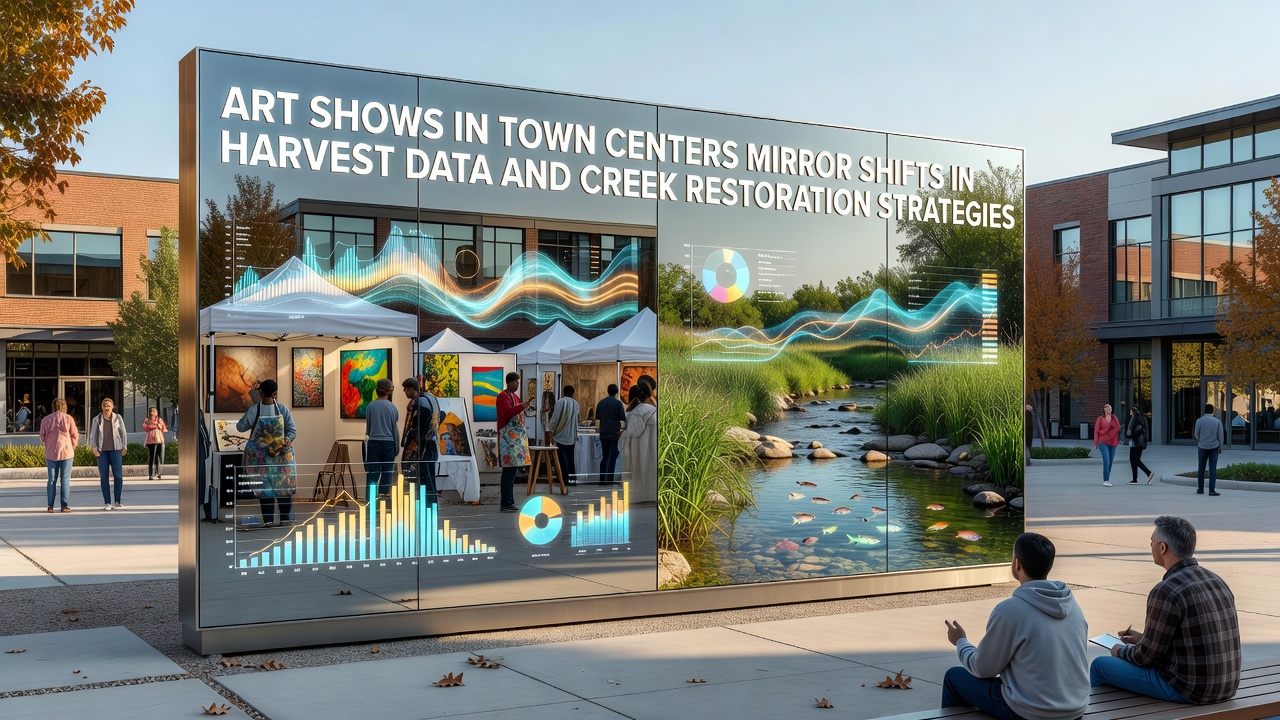
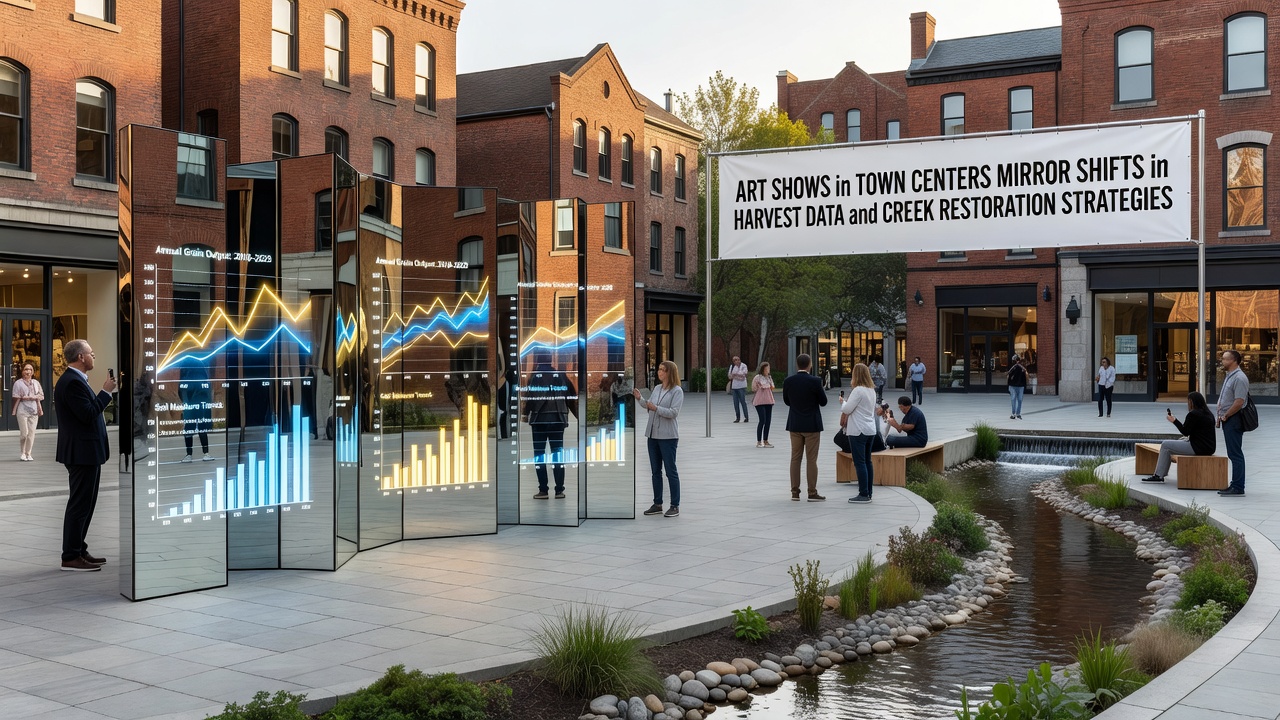
Art exhibitions in town centers across Creamvale have begun to incorporate elements drawn from recent harvest statistics and ongoing creek restoration projects, creating displays that track measurable changes in local agriculture and waterway management. Data collected through county monitoring programs shows variations in crop yields over the past five seasons, and several galleries have integrated those figures into visual installations using charts, maps, and sculptural representations.
Harvest Data Trends Reflected in Local Exhibits
County agricultural reports indicate that wheat and corn outputs declined by 12 percent between 2023 and 2025 while specialty vegetable production increased by 8 percent during the same period. Artists working with community organizers have translated these numbers into mixed-media pieces that hang in the central plaza gallery space. One installation uses color-coded fabric panels to represent field acreage shifts, and another displays soil sample photographs arranged according to yield-per-acre statistics released by the state department of agriculture.
Exhibits scheduled for October 2026 will include updated datasets from the current growing season, allowing visitors to compare earlier panels with new material produced after the latest harvest collection cycle. Organizers coordinate with extension service offices to verify each figure before it appears in any artwork.
Creek Restoration Projects and Artistic Interpretations
Restoration work along Valley Creek and adjacent tributaries has involved removal of invasive vegetation, installation of native plant buffers, and construction of log structures to stabilize banks. Federal environmental agency records list 3.2 miles of streambed treated since 2022, with water quality measurements showing reduced sediment loads at three monitoring stations. Local artists have responded by creating site-specific pieces that document these interventions through photography, drawings, and temporary installations placed near the creek access points.
One series of prints maps the locations of newly planted willow and alder stands against historical channel alignments, while a separate sculpture group uses reclaimed wood from restoration crews to form abstract representations of flow patterns. These works appear in rotating shows at the town hall annex, where informational panels supplied by the county public works department accompany each piece.
Community Coordination and Data Integration
Gallery curators meet quarterly with representatives from both the agricultural cooperative and the watershed council to review new datasets before selecting themes for upcoming shows. Meeting minutes record discussions about which statistics best illustrate measurable progress, such as changes in pollinator counts along restored riparian zones or adjustments in irrigation volumes reported by participating farms. This process ensures that displayed content remains anchored in verified numbers rather than interpretive commentary.
Schools in the district have incorporated field trips to these exhibits into their environmental science curriculum, with students comparing the artistic renderings against raw spreadsheets downloaded from the county open-data portal. Teachers note that the visual format helps students identify patterns across multiple variables that might otherwise remain separate in tabular reports.
Regional Comparisons and Broader Context
Similar patterns appear in neighboring counties where harvest monitoring programs and stream improvement initiatives run in parallel. A report issued by the national agricultural statistics service documents comparable yield shifts in adjacent valleys, while an international river restoration network lists parallel bank-stabilization techniques applied in projects across multiple states. Creamvale organizers reference these external sources when planning exhibit layouts to provide visitors with context beyond local boundaries.
One link appears in the current catalog to the USDA National Agricultural Statistics Service for raw harvest tables, and another points to the Australian Department of Climate Change, Energy, the Environment and Water for comparative stream restoration metrics from projects in similar climates.
Future Planning for 2026 and Beyond
Planning documents for the October 2026 season list additional data layers, including groundwater level readings and pollinator survey results gathered during the summer months. Artists have begun preliminary sketches based on preliminary figures released in late summer 2025, with final selections scheduled after the full harvest report arrives in November. The town center association maintains a shared calendar that coordinates exhibit changeovers with restoration work windows to avoid conflicts with field crews.
Attendance records from previous shows indicate steady visitor numbers, with peak attendance occurring on weekends when restoration site tours run concurrently. Organizers track these figures through ticket scans and compare them against county event data to adjust promotion timing for the next cycle.
Conclusion
Exhibitions in Creamvale town centers continue to present verified harvest statistics and documented creek restoration outcomes through visual formats that allow direct comparison across seasons. Coordination between agricultural offices, watershed groups, and gallery staff maintains consistency between displayed content and official records, while external references provide additional regional perspective. The October 2026 schedule will incorporate the newest available measurements once collection concludes.